B2B SEO reporting is the practice of showing how organic search and AI search visibility turn into qualified leads, pipeline and revenue, not only traffic and rankings. It differs from a standard SEO report because B2B sales cycles are long, several people sit in the buying decision, and a lead only becomes revenue in the CRM months after the first search. A good report therefore starts with a short summary, shows visibility and organic traffic from Google, connects key events to the CRM, and ends with the actions you want to take next.
If you are building one yourself or judging the reports an agency sends you, this guide covers what to include, what to drop, how to link search data to deals, how to handle long sales cycles, and a one-page template you can copy. It also reflects how we approach reporting in our B2B SEO agency work, where reports connect visibility to leads and pipeline wherever the data allows.
What B2B SEO reporting is, and why generic reports fall short
Generic SEO reports stop at clicks, rankings and sessions. That is fine for a team that wants to know whether a page is indexed, but it is a poor fit for the people who fund SEO. A finance lead or founder wants to know what organic search did for pipeline and revenue, and a report full of position charts does not answer that.
B2B makes the gap wider. Organic search often starts a journey that ends weeks or months later, and the deal may close through a direct visit, a sales call or a referral. The first touch and the final touch rarely match, so a report that only counts last-click conversions misses most of what search did.
Three things separate a B2B report from a generic one:
- It reports on commercial pages, not total traffic. A rise in blog sessions tells you little. A rise in visits to service, product and comparison pages tells you much more.
- It follows the lead into the CRM. The report keeps going after the form fill, through qualification, opportunity and closed-won.
- It states how sure it is. Attribution is never perfect, so each claim carries a plain label for how well the data supports it.
An ecommerce store can read revenue straight from an analytics tool, which is one reason B2B SEO differs from B2C SEO in how it is measured. In B2B, the money lives in another system, and the report has to join the two.
What should an SEO report include?
A B2B SEO report should include seven parts, in this order:
- Executive summary: what changed, the likely reason and the decision you need.
- Visibility: impressions, clicks, click-through rate and non-branded queries from Google Search Console.
- Organic traffic quality: sessions and engagement on commercial pages, from GA4.
- Leads and conversions: key events that start from organic landing pages.
- Pipeline and revenue: opportunities and closed-won deals from your CRM, with organic as the original source.
- AI visibility: how often your brand appears in AI answers to a fixed set of buyer prompts.
- Work done and next actions: what shipped this period, what ships next and who owns each item.
The order matters. Business leaders read the first page and rarely the fifth, so the first page carries the verdict.
The executive summary comes first
Write the executive summary in five to ten lines. Say what changed, give the most likely reason, and name the decision you need from the reader. If non-branded impressions on service pages grew but demo requests stayed flat, say so, then say what you think is happening and what you plan to test.
Do not write the summary as a list of numbers, and keep jargon out of it, because the reader may be a client or a board member. A reader who only has two minutes should still know whether things are going well, what worries you and what you need from them.
Recommendations, not just numbers
Every finding in the report should end with an action and an owner. “Impressions on the pricing page fell” is an observation. “Impressions on the pricing page fell after the template change on the 12th, the SEO lead will check indexing and canonical tags this week” is a finding someone can act on.
If a section has no action attached, ask whether it belongs in the report at all. It might belong on a team dashboard instead.
Metrics to track, layer by layer
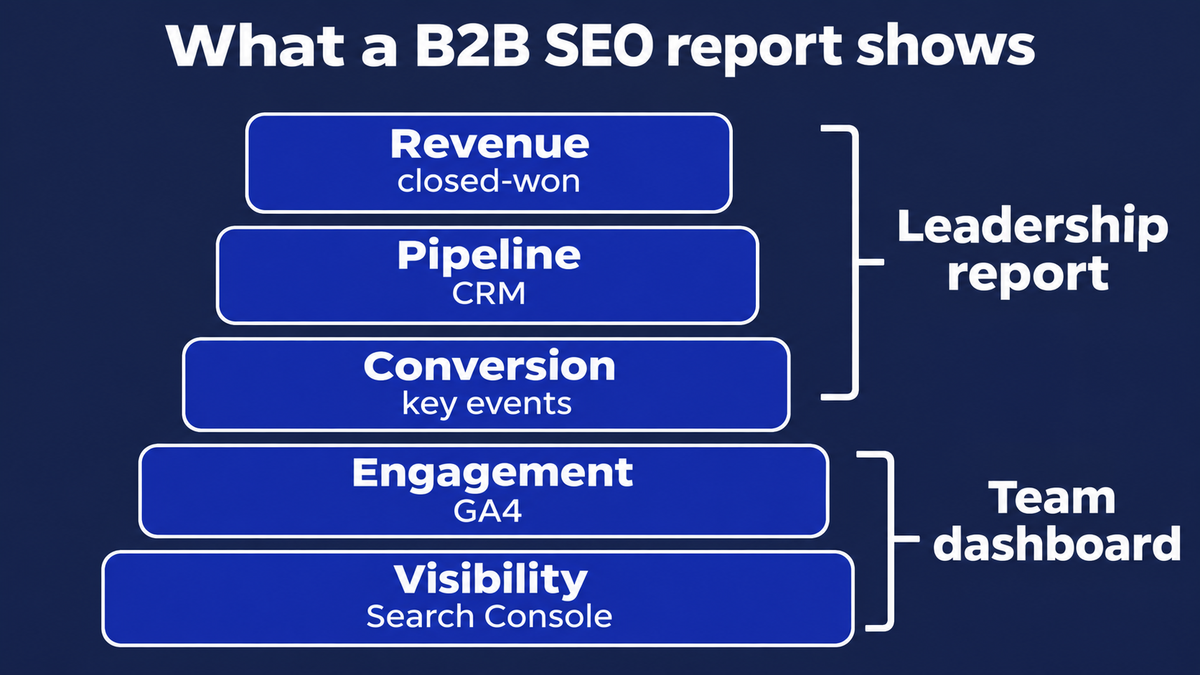
The cleanest way to organise B2B metrics is in five layers, from the first impression in Google to revenue in the CRM. Each layer has its own source and its own reader.
| Layer | Metrics | Source | Who reads it | What it tells you |
|---|---|---|---|---|
| Visibility | Impressions, clicks, CTR, average position, non-branded queries | Google Search Console | SEO team, summarised for leadership | Whether buyers can find you for the searches that matter |
| Engagement | Organic sessions to commercial pages, engaged sessions on key pages | GA4 | Marketing lead | Whether the visits are from the right people and pages |
| Conversion | Key events from organic landing pages, such as demo requests, contact forms and trials | GA4 | Marketing lead | Whether visitors take the next step |
| Pipeline | MQLs, SQLs, opportunities and pipeline value with organic as original source | CRM such as HubSpot or Salesforce | Marketing and sales leads, leadership | Whether search produces sales conversations |
| Revenue | Closed-won deals, revenue and win rate for organic-sourced deals | CRM | Leadership, finance | Whether search pays for itself |
Google defines the Search Console metrics plainly. In the Performance report, clicks are “the number of times a user clicked your site from Google Search results,” impressions are “how many times your site appeared in Search results,” CTR is “the click count divided by the impression count,” and average position is “the average position of the topmost result from your site.” Use those definitions in your report so nobody argues about what a number means.
Organic traffic, measured by page type
Report organic traffic split by page type, not as one total. Group your site content into commercial pages (services, products, pricing, comparisons, demo and contact pages), educational pages (blog posts and guides) and everything else. Commercial pages show buying intent, so growth there matters most. Educational pages matter too. This content builds awareness and links, and its traffic seldom converts directly.
A blog that doubles its sessions while commercial pages stay flat is a different story from the reverse, and a single total hides which one you have.
Keyword rankings and daily rank tracking
Rankings are useful for the SEO team and rarely useful for the board. Track a fixed set of keywords for your commercial pages, chosen from your keyword research, and review them weekly or monthly in a team dashboard. Daily rank tracking can help during a migration or an algorithm update, but day-to-day movement is mostly noise, and reporting it to leadership invites questions you cannot usefully answer.
Remember that average position is an average across all the queries a page appears for, so it can drop when a page starts showing for more, lower-ranked queries even though nothing went wrong. Look at it alongside impressions and clicks, never alone.
Leads and qualified leads
Count qualified leads, not just leads. A form fill from a student or a job seeker counts as a conversion in GA4, but it does not count as a sales opportunity. Agree the definitions of MQL and SQL with sales before you start, write them in the report, and keep them stable. Changing the definition mid-year makes trends meaningless.
Where you can, show leads and qualified leads side by side. If organic leads grow but qualified leads do not, the problem is usually the pages and queries attracting the wrong visitors, which is useful to know.
Pipeline and revenue
Pipeline and revenue are the metrics leadership cares about, and they come from the CRM, not from SEO tools. Report the number of opportunities, the pipeline value and the closed-won revenue for deals where organic search was the original source. Add the win rate if you have enough deals to make it meaningful.
If volumes are small, which is common in B2B, say so. A handful of deals can swing a percentage a long way, and a note that the sample is small protects both you and the reader.
Metrics to stop putting in front of leadership
Some metrics are fine for a team dashboard and a waste of space in a leadership report. A simple rule works: if a metric does not change a decision, move it out of the report.
These are the usual candidates to drop:
- Raw total traffic with no segmentation. It rises and falls with blog posts and seasonality and says nothing about buyers.
- Keyword counts. Ranking for 3,000 keywords means little if none of those keywords bring a buyer, and a long keyword list can hide that.
- Domain authority scores. They are third-party estimates, not something Google reports, and they do not map to pipeline.
- Total backlink counts. Ten links from relevant industry sites beat a thousand from low-quality directories, so the count hides the quality.
- Bounce rate. It is a thin signal on pages designed to answer a question quickly.
- Counts of pages optimised. This is activity, not outcome.
None of these are banned. Keep them in the team view, where they help diagnose problems. For a deeper look at the difference between activity and outcome, see our post on proving marketing ROI beyond vanity metrics.
How to connect SEO data to pipeline and revenue
Connecting SEO data to pipeline takes six steps, and most of the work sits in the CRM and the forms, not in SEO tools. Our B2B SEO agency process puts this tracking setup before any content work for the same reason: a result you cannot trace cannot be reported.
- Define the conversions that matter and mark them as key events in GA4. Google says events that measure important actions “are now called ‘key events’”, and that a “conversion” now refers to an action used to measure ad campaign performance. For a B2B site, key events are usually demo requests, contact form submissions, trial sign-ups and pricing-page requests.
- Make sure forms pass the source into the CRM. In HubSpot, the Original Traffic Source property “displays the first known web source through which a contact interacted with your business”, with values such as Organic search. Test a form submission from an organic visit and check the contact record.
- Agree lifecycle stages with sales. Lead, MQL, SQL, opportunity and customer should each have a written definition and an owner who updates it.
- Report organic-sourced and organic-influenced pipeline separately. The next section explains the difference.
- Link Search Console to GA4. Google notes that GA4’s Search Console reports “include a maximum of 16 months of data”, and that data reaches Analytics about two days after Search Console collects it. Linking puts query and landing page data next to engagement data.
- Build one view that runs from query and page to key event, contact and deal. Looker Studio works for the front half, and the CRM’s own reports work for the back half. Even a spreadsheet that joins them by landing page and month is better than nothing.
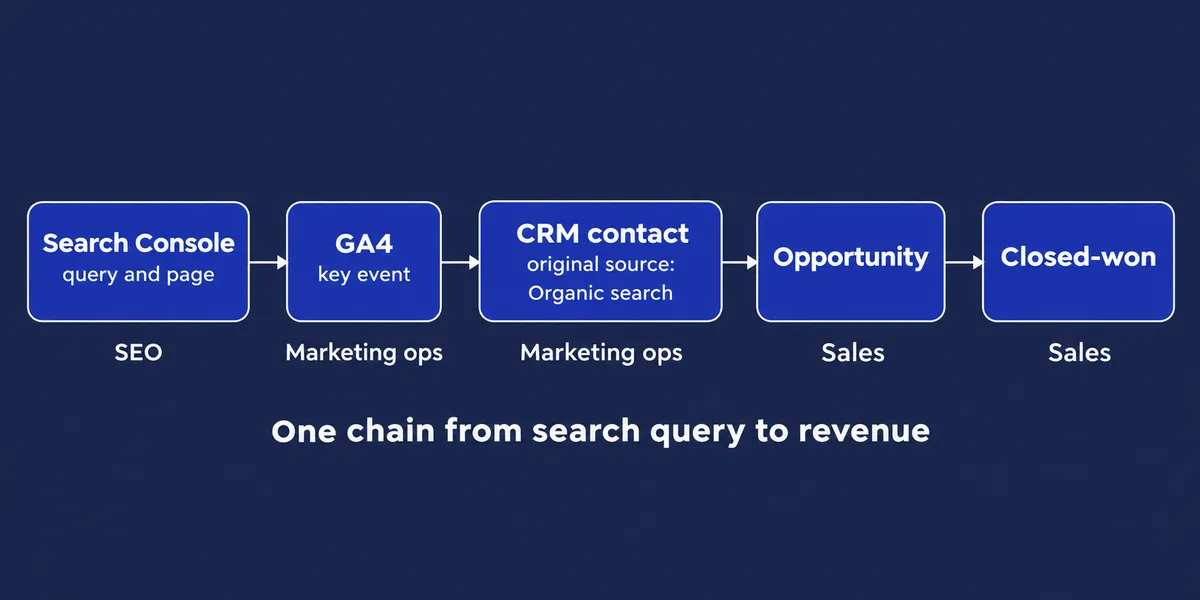
Once the chain is in place, a statement like “non-branded impressions on the integration pages grew, key events from those pages grew, and two of those contacts are now open opportunities” stops being a guess and becomes something you can show.
Sourced vs influenced pipeline
Organic-sourced pipeline counts deals where organic search was the first known source of the contact. Organic-influenced pipeline counts deals where the contact touched organic search at any point, even if the first touch or the final touch was something else.
Report both, and label them. Sourced is conservative and easy to defend, but it under-credits search in a long B2B journey. Influenced shows the wider role search plays, but it overlaps with other channels, so you cannot add it to their numbers. A report that shows only one of them either understates SEO or overstates it.
Who owns which number
Reports go wrong when nobody owns the inputs. A simple split keeps the chain intact:
- SEO owns Search Console data and the interpretation of visibility.
- Marketing operations owns the CRM source fields and GA4 events, so a tracking change does not silently break the report.
- Sales owns lifecycle stages and keeps deal records current.
Put these owners in the report’s data notes. When a number looks wrong, the reader then knows who to ask.
Reporting SEO across a long sales cycle
A long sales cycle breaks the monthly rhythm most SEO reports assume. Leads created this month may not turn into revenue for several quarters, so a report that waits for closed-won will always be out of date. The fix is to report the same work at three speeds: early signals now, pipeline as it forms, and revenue as it lands. We do not quote a typical cycle length here, because it varies by market and deal size, so use your own CRM data.
Use cohorts to follow leads over time
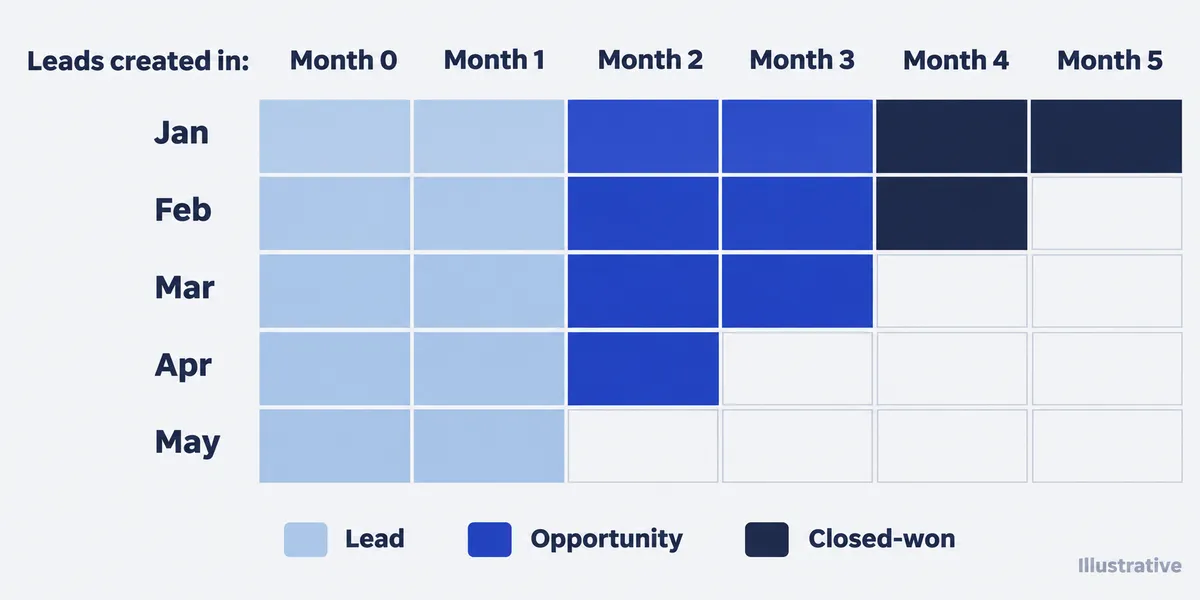
Group leads by the month they were created, then follow each group over the following quarters to see how many become opportunities and closed-won deals. This is a cohort view. It shows the real lag in your business and stops you comparing this month’s leads with last month’s deals.
A cohort table has months of lead creation down the side and months since creation across the top. Each cell shows how many leads from that cohort reached a stage. Early cells fill in quickly, later cells fill in slowly, and a half-empty row is normal, not a failure.
Use leading indicators before pipeline exists
When pipeline lags by months, you need signals that move sooner. Good leading indicators for B2B websites include:
- Non-branded impressions and clicks on commercial pages.
- Organic key events, such as demo requests and contact forms.
- Sales-accepted leads from organic sources.
- Growth in the number of commercial queries where you appear on page one.
Present these as early signals, not proof. Their job is to tell you whether the work is on track before the CRM can confirm it.
Label how confident each pipeline claim is
Give each pipeline claim one of three labels:
- High confidence: the CRM shows organic as the original source and the deal record matches.
- Medium confidence: the claim rests on assisted touches or on what the buyer told you, for example in a “How did you hear about us?” field.
- Directional: a trend that moves with SEO work but has no clean link to a deal.
Self-reported attribution is a useful cross-check. A buyer who says they found you through Google, or through an AI assistant, confirms what the source field says or fills in what it missed. Perfect attribution does not exist, so a report that admits that is more believable than one that claims it.
Compare periods with care
Many B2B markets have seasonal demand, with quiet summers, slow Decembers or budget cycles that bunch purchases in certain months. Comparing this month with last month then tells you about the calendar, not about SEO. Year over year is usually the fairer comparison.
Google states that “Search Console keeps data for the last 16 months.” Google also lets you schedule a daily export of your performance data to BigQuery, so set that up early if you want a longer history to compare against later. Check what the export covers before you rely on it for past periods.
Separate branded and non-branded search
Branded searches are searches that include your company name. Non-branded searches are everything else. Reports should split them, because they tell you different things.
Branded demand reflects work done elsewhere: sales calls, events, PR, podcasts and word of mouth. It is a good sign, but SEO did not create most of it. Non-branded demand, where buyers search for a problem or a category without knowing your name, is the clearest sign that SEO is reaching new buyers. If you blend them, a surge in branded searches after a conference can make SEO look like a hero for a month.
Google now has a branded queries filter that separates data based on whether or not the search term included your brand name. There are limits. It has history from March 2025 when it was first introduced, it is not available for sites with a low number of impressions, and Google warns that some queries may be incorrectly identified as branded or non-branded. For older periods, or for small sites, use a regular expression filter on your brand terms and common misspellings.
Report non-branded clicks and impressions on their own line, and show branded alongside them for context. If non-branded grows while branded is flat, you are reaching new buyers.
How to measure AI visibility in SEO reporting
AI visibility belongs in a B2B SEO report as one panel, with honest notes on what you can and cannot measure. Buyers now ask assistants and AI features questions they used to type into Google, so leaving AI out leaves a gap.
Here is what you can measure today:
- Google’s tool cannot isolate AI features. Google says sites that appear in AI Overviews and AI Mode are included in the overall search traffic and reported within the Web search type. You see the traffic, but you cannot split it out.
- Referral visits from AI assistants show up in analytics. They usually appear as referrals in GA4, and HubSpot’s Original Traffic Source property includes an AI Referrals value, so contacts who arrive that way can be counted in the CRM.
- Prompt tracking gives you a sample of the answers. Pick a fixed set of buyer prompts, built from the same keyword research as your content plan, check them on a schedule, and record whether your brand is mentioned, recommended or cited. It is a sample, not a census, so label it that way.
Keep the panel short: the prompt set, the mention and citation rate, the AI referral visits and any leads from them. Our guide on how to track AI visibility covers the method in detail, and our generative engine optimization page explains the work that moves these numbers.
Reporting cadence and audience
Different readers need different reports at different speeds. Matching cadence to audience stops the monthly report from becoming a document nobody opens.
| Cadence | Audience | Purpose | What to show |
|---|---|---|---|
| Weekly | SEO team | Catch problems early | Indexing, tracking breaks, ranking drops on key pages |
| Monthly | Marketing lead | Review performance and plan | Visibility, engagement and conversion layers, work done, next month’s actions |
| Quarterly | Leadership and finance | Make budget decisions | Pipeline, revenue, cohort view, AI answers summary, three priorities |
The weekly check is a working tool, not a report. The monthly report is where you explain what moved and why. The quarterly review is where you ask for decisions: more budget, a change of focus or a pause on something that is not working. We describe how an agency handles the monthly report and quarterly review in our post on the B2B SEO agency process, so we will not repeat it here.
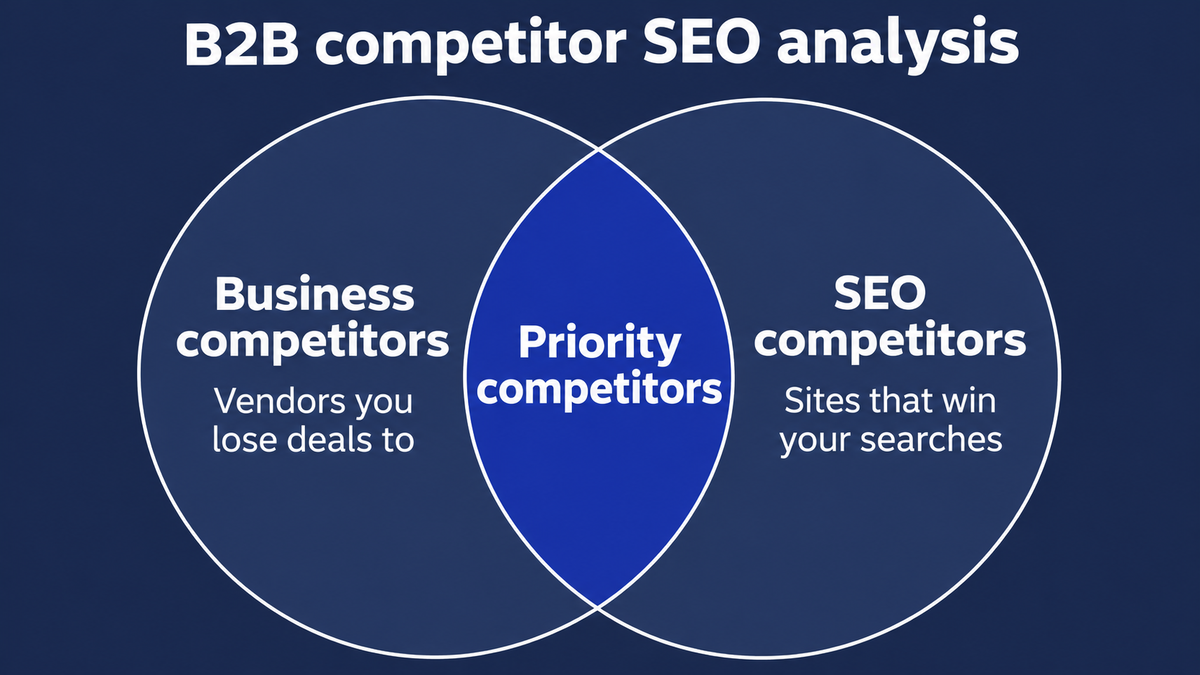
For a quarterly review, include a view of how you compare with the other sites competing for your buyers. A B2B competitor SEO analysis gives you the share-of-voice view that makes a flat quarter easier to explain, because it shows whether the whole market moved or only you.
SEO dashboard vs a written summary
An SEO dashboard shows live numbers that people can check themselves. A written report interprets those numbers, explains what changed and asks for decisions. You need both, and they do different jobs.
Build the dashboard for the team and for anyone who likes to explore, with search, GA4 and CRM data in one place. Write the report for people who will not open the dashboard. A dashboard with no commentary leaves readers to draw their own conclusions, and they will often draw the wrong ones.
A one-page SEO reporting template
A business can fit its whole SEO update on one page if every section earns its place. The template below uses placeholders, not real numbers, so you can copy the structure and fill in your own data.
| Section | What goes in it | Example line |
|---|---|---|
| Summary and decision needed | What changed, why, and what you need from the reader | ”[X] demo requests from organic, up or down against last quarter. We need a decision on [Y].” |
| Non-branded visibility | Non-branded impressions and clicks for commercial queries | ”Non-branded clicks to service pages: [X], versus [Y] a year ago.” |
| Organic traffic to commercial pages | Sessions and engagement on commercial pages, split from blog traffic | ”Commercial page sessions from organic: [X]. Blog sessions: [Y].” |
| Organic key events | Demo requests, contact forms and trials from organic landing pages | ”[X] key events from organic, of which [Y] from non-branded entry pages.” |
| Pipeline | Organic-sourced and organic-influenced opportunities and value, with a confidence label | ”[X] organic-sourced opportunities (high confidence), [Y] influenced (medium).” |
| Revenue (cohort) | Closed-won revenue by lead-created cohort | ”The [month] cohort has produced [X] closed-won deals so far.” |
| AI answers panel | Prompt set results, AI referral visits and leads | ”Mentioned in [X] of [Y] tracked prompts. [Z] visits from AI assistants.” |
| Work completed | What shipped this period | ”Published [X] pages, fixed [Y] technical issues, earned [Z] links.” |
| Next three priorities | Three actions, each with an owner and a date | ”1. [Action], owner [name], due [date].” |
| Risks and data notes | Tracking gaps, small samples, definitions that changed | ”Form tracking broke on [date], so key events are understated for that week.” |
You can build this in Looker Studio, a spreadsheet or a slide. The format matters less than the habit of putting the summary and decision first, and the risks last, where a careful reader will still find them.
SEO analytics tools and their data limits
Every digital analytics tool has limits, and a good report says what they are. Four tools cover most B2B reporting.
Google Search Console
Google Search Console is the source for impressions, clicks, CTR, average position and the queries behind them. It keeps data for the last 16 months, so export it if you need more history. Google offers a scheduled daily export to BigQuery for that. The branded queries filter described above helps with the branded split. It shows what happens in Google, and not what visitors do after they land.
GA4
GA4 shows what visitors do on your site, including the key events you define. Its data retention setting can be set to two or 14 months on standard properties, and Google states that the setting does not affect standard aggregated reports. It only affects explorations and funnel reports. So a custom exploration may lose history that a standard report keeps.
Your CRM
HubSpot, Salesforce and similar tools hold the data leadership cares about: contacts, opportunities and revenue. In HubSpot, Original Traffic Source can be edited manually, and changing it clears the drill-down properties. Keep those fields locked down to a few people, because one careless edit can erase the evidence that a deal came from organic search.
Looker Studio and dashboard software
Looker Studio’s Search Console connector offers two ways to aggregate data, by site impressions or by URL impressions. The two methods can give different totals, so pick one and note which you used.
Tools such as DashThis can pull several sources into one dashboard and are useful for agencies that need white-label reports for many clients. Rank trackers and platforms such as Ahrefs and Semrush add keyword and competitor context. The tool matters less than the template and the data chain behind it. A well-structured report in a spreadsheet beats a polished dashboard that nobody can trace back to a deal.
Common reporting mistakes
Most weak reports share the same handful of problems, whatever the content or keyword focus:
- Reporting traffic with no lead data. Traffic without conversions tells leadership nothing about revenue.
- Counting every lead as equal. Unqualified leads inflate the numbers and lose sales’ trust.
- Letting the CRM overwrite the original source. A manual edit or a bad integration can erase the first touch.
- Comparing month over month across seasonal dips. You end up reporting the calendar.
- Claiming exact attribution. A report that claims precision invites an argument it cannot win.
- Burying recommendations. If the actions sit on page nine, nobody takes them.
- Sending one report to every audience. The team, the marketing lead and the finance director need different views.
- Ignoring branded demand. Without the split, SEO takes credit for work that sales, PR and events did.
If you recognise several of these, you do not need more data. You need a clearer structure, and one reader in mind per report. Our SEO services include this kind of reporting set-up for teams that want it fixed properly once.
What to show when the site is new
A new site has no pipeline to report, and pretending otherwise damages trust. In the first months, report early signals: whether pages are indexed, whether impressions are appearing for target queries, and when the first non-branded clicks arrive. Add the work done, because progress in the early months is mostly about what shipped.
Set expectations in the first report. How long SEO takes to show results depends on the site’s age, competition and the work involved, and a report that explains this early saves a difficult conversation in month four. As data builds up, move the report up the layers, from visibility to engagement, conversions and finally pipeline.
Turning results into proof
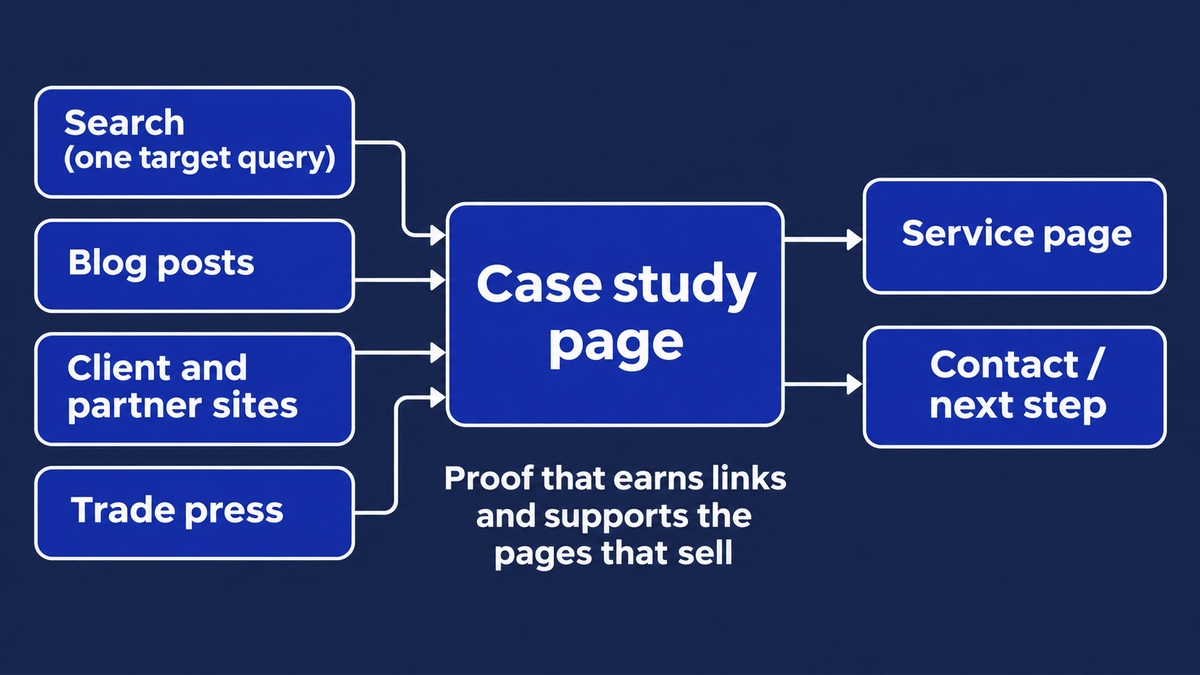
A report is also raw material for sales. Once a quarter, look through the results for one outcome with clean data, where the CRM source, the key events and the deal record all agree. That is your best candidate for a case study.
Write it up while the details are fresh, ask the client for a quote if they are happy to give one, with the baseline, what changed and the honest caveats. Our guide on how to turn SEO results into a B2B case study walks through that. If you want help setting up the reporting chain described above, talk to us about your reporting and we will look at your data with you.
Frequently Asked Questions
What KPIs belong in a report for leadership?
Keep it to a handful: non-branded visibility on commercial pages, organic key events such as demo requests, organic-sourced and organic-influenced pipeline, closed-won revenue from organic, and a short panel on AI answers. Rankings, backlink counts and total traffic belong on the team dashboard, where they help diagnose problems.
How often should you send SEO reports?
Weekly checks suit the SEO team, a monthly report suits the marketing lead, and a quarterly review suits leadership and finance. Match the cadence to the decision each person makes. Reviewing pipeline weekly adds noise, and reviewing indexing problems quarterly means they sit unfixed for months.
How do you show SEO results when the sales cycle is long?
Group leads into cohorts by the month they were created and follow each cohort to opportunity and closed-won over later quarters. In the meantime, report leading indicators such as non-branded impressions on commercial pages and organic key events. Label every pipeline claim with how confident you are in it, and compare year over year instead of month over month.
Can you see AI Overviews traffic on its own?
Not separately. Google counts traffic from AI Overviews and AI Mode inside the Web search type in Search Console, so you cannot split it out there. To measure it, combine referral traffic from AI assistants in GA4 or your CRM with a fixed set of buyer prompts that you check on a schedule.
What is the rule of 7 in B2B?
It is an old marketing rule of thumb that a buyer needs several touches, often said to be seven, before acting. For reporting, it is a useful reminder that organic search is usually one touch among many. A last-touch report will under-credit it, which is why you also report organic-influenced pipeline.
Is SEO dead or evolving in 2026?
It is evolving. Buyers now get answers from AI features and assistants as well as ten blue links, so reports need to cover AI answers alongside rankings and leads. Google still reports traffic from its AI features inside Search Console, so the core data has not gone away.

Written by
Adriaan van Swieten
Adriaan leads Stijg Media and works directly on search, AI visibility, websites, and local growth strategy.
Meet Adriaan